Welcome to caQtDM’s documentation!#
caQtDM Manual#
About this manual#
This manual has been written in Sphinx Ret. It has to be noted that caQtDM is thought of as a replacement of the well known EPICS [1] Display Manager MEDM [2], therefore this manual is of course also inspired by the existing MEDM manual.
The HTML was converted to restructured text using spinx.
  pip install sphinx
  pip install pydata-sphinx-theme
  make singlehtml
Introduction#
caQtDM is a package based on Qt developed at PSI as a successor of
MEDM, a well known package used in the EPICS community for building
synoptic displays. The caQtDM package uses the standard Qt GUI (Qt
designer) for designing synoptic displays, containing all the
graphical control elements necessary to visualize and control a facility. Qt
designer uses the custom widgets designed for this purpose and writes
a description file (.ui file) that will be used by the synoptic viewer
caQtDM. A reload function in caQtDM allows to rapidly see the changes
made by the editor in order to accelerate the process of editing and
viewing.
The heart of the package are the graphical objects (Widgets) plugged into the Qt designer. These widgets will be described in detail with their properties below. Many objects have been built and more are introduced as soon as they are needed. The Qt system allows to continuously add or modify new objects very easily.
Technically the package consists of three class libraries with the graphical objects, a class library used by the viewer or other applications and the viewer (caQtDM) itself as well as three libraries with the plugin definitions for the Qt designer. The editor (Qt designer) is part of Qt. It has to be noted that the graphical objects are not control system aware. The graphical objects have properties and methods used by the editor. The control system knowledge is then integrated and handled by the viewer. This architecture allowed us to handle three control systems easily: epics3 [3], epics4 [4], and an older in-house control system. These are all handled by the viewer. This distribution supports epics3 by default. Epics4 can be integrated when building it, but only a few tests could be done while not many process variables could be tested so far.
Part of the package is also a converter (adl2ui) that can convert MEDM
.adl files into .ui files used by the caQtDM package. In most cases
this converter gives good results. Besides the already mentioned .ui
files, the viewer can also use in-house developed .prc files. These
last files represent ASCII files to be edited with any text editor
using our in house syntax.
The Qt system is widely used on many platforms today and is therefore an ideal system to develop new applications. The advantage of Qt is therefore that an application using this architecture will run on many platforms, so caQtDM will run on linux as well as on windows systems.
Qt Designer: editor#
The designer coming with Qt is the editor used for developing the synoptic screens. In this manual we will not describe this editor exhaustively, as the editor has it own manual that can be called by pressing the F1 key. The editor allows for graphical objects to be added by dragging and dropping them into the synoptic display. The properties of the graphical objects can then be customized in the property editor. The most important property is normally the device that is monitored or controlled and is represented by the property channel. An exhaustive description of the graphical objects and their properties will be given below.
Install#
Since version 3.1.4 of caQtDM a new build and installation procedure working for several linux platforms is available.
First you will have to unpack the tar archive, which will create the necessary directories and files. In the upper directory you will find the necessary procedures to build the package, to install it, and to run it locally without installing.
you will have to install Qt and qwt if they are not already installed. On modern systems Qt should already be installed, but the qt-designer not necessarily and you should install it (eventually with sudo apt-get install qt*-designer). qwt is normally not installed and you should install this too.
you will have to install EPICS (base)
all the environment variables used for the installation will be defined in the script
caQtDM_Env. If some of the variables are already defined in your environment the script will use them, otherwise they will be defined. It is up to you to edit this file and adapt the variables to your environment.the script
caQtDM_BuildAllwill now build you the package into the directory./caQtDM_Binaries. There, you should obtainadl2ui,caQtDM,libqtcontrols.soandlibcaQtDM_Lib.soas well as adesignerdirectory containing 3 fileslibqtcontrols*_plugin.so. if you encounter a problem when building due to some environment variable problem or because not everything was installed before, you may correct your problem and run the script again. In case you want to clean up you use the scriptcaQtDM_CleanAllwhich will also delete the resulting binaries.you may try to install the package: the package should normally be installed in the EPICS extensions and the environment variables are pointing to them.
running
caQtDM: when the package has been successfully built into the directory./caQtDM_Binaries, you can startcaQtDMby using the scriptstartDM_Localand the qt-designer by the scriptqtdesigner(all located in the main directory where you expanded the tar file). These scripts will set some important environment variables in order to set the path, the plugin_path and to point to the test directory provided with the package (./caQtDM_Tests). In this directory are also the stylesheets located to be used for a nice rendering. You may call thetest.uifile with the above mentioned scripts. In order to test the display some EPICS channels have to be defined. This can be done by running a softIoc shell called with run-epics, which is also provided in the test directory.in case you have qwt 6.1 or greater you will have to use the file qwt_thermo_marker_61 in caQtDM_QtControls/src. (instead of qwt_thermo_marker)
in case you are already using Qt5 or Qt6 with qwt6.2 the build process should also be straight forward.
Instructions for compiling caQtDM on Windows/Linux/Mac Requirements:
- Min:
Qt 4.8.5
Qwt 6.0.1
EPICS 3.14.12
MS Visual Studio 2010
Wix 3.0
- Max:
Qt 6.9.0
Qwt 6.3.0
EPICS 7.0.9
MS Visual Studio 2022
Wix 3.11
With
caQtDM_Env.batyou can configure your system. All settings which are needed will be taken from here.The build process can be started with the batchfile :
caQtDM_BuildAll.batThe packaging is done with the batch file :
caQtDM_Build_Package.batThis will generate a MSI installation file in the foldercaQtDM_Binaries.To clean the Folder you should use
caQtDM_CleanAll.bat.
Example build settings for Debian 12#
 apt install git
 apt install qtcreator
 apt install gcc
 apt install g++
 apt install qwt
 apt install qwt-qt6
 apt install qwt-qt5
 apt install libqwt
 apt install libqwt-qt5-dev
 apt install qmake
 apt install qt5-dev
 apt install qt6
 apt install qt5-qmake
 apt install qt5-default
 apt install qtbase5-dev
 apt install qt5designer
 apt install qt5-designer
 apt install qttools5-dev-tools
 apt install qtsvg5-examples
 apt install qttools5-dev
 apt install qtsystems5-dev
 apt install libqt5svg5-dev
 apt install libzip-dev
 apt install python3-dev
 apt install libqt5x11extras5-dev
       #!/bin/bash
       if [ -z "$QTHOME" ];                then export   QTHOME=/usr;
       fi
       if [ -z "$QWTHOME" ];               then export   QWTHOME=/usr;
       fi
       if [ -z "$QWTINCLUDE" ];            then export   QWTINCLUDE=/usr/include/qwt;
       fi
       if [ -z "$QWTLIB" ];                then export   QWTLIB=/usr/lib;
       fi
       if [ -z "$QWTVERSION" ];            then export   QWTVERSION=6.1;
       fi
       # on unix library can be libqwt or libqwt-qt5 or ...
       if [ -z "$QWTLIBNAME" ];            then export   QWTLIBNAME=qwt-qt5;
       fi
       if [ -z "$EPICS_BASE" ];            then export   EPICS_BASE=/home/helge/epics-base;
       fi
       if [ -z "$EPICSINCLUDE" ];          then export   EPICSINCLUDE=${EPICS_BASE}/include;
       fi
       if [ -z "$EPICSLIB" ];              then  export  EPICSLIB=${EPICS_BASE}/lib/$EPICS_HOST_ARCH;
       fi
       if [ -z "$EPICS4LOCATION" ];         then  export  EPICS4LOCATION=/home/mezger/EPICS-CPP-4.6.0/
       fi
       if [ -z "$EPICSEXTENSIONS" ];     then  export  EPICSEXTENSIONS=/usr/local/epics/extensions;
       fi
       if [ -z "$QTCONTROLS_LIBS" ];       then export  QTCONTROLS_LIBS=`pwd`/caQtDM_Binaries;
       fi
       if [ -z "$CAQTDM_COLLECT" ];       then export  CAQTDM_COLLECT=`pwd`/caQtDM_Binaries;
       fi
       export  QTBASE=${QTCONTROLS_LIBS};

       if [ -z "$CAQTDM_CA_ARCHIVELIBS" ];       then export  CAQTDM_CA_ARCHIVELIBS=`pwd`/caQtDM_Binaries;
       fi
       if [ -z "$CAQTDM_LOGGING_ARCHIVELIBS" ];       then export  CAQTDM_LOGGING_ARCHIVELIBS=`pwd`/caQtDM_Binaries;
       fi

       if [ -z "$QTDM_LIBINSTALL" ];  then  export  QTDM_LIBINSTALL=$EPICSEXTENSIONS/lib/$EPICS_HOST_ARCH;
       fi
       if [ -z "$QTDM_BININSTALL" ];   then  export  QTDM_BININSTALL=$EPICSEXTENSIONS/bin/$EPICS_HOST_ARCH;
       fi

       if [ -z "$PYTHONVERSION" ];   then  export  PYTHONVERSION=3.11;
       fi
       if [ -z "$PYTHONINCLUDE" ];   then  export  PYTHONINCLUDE=/usr/include/python$PYTHONVERSION;
       fi
       if [ -z "$PYTHONLIB" ];   then  export  PYTHONLIB=/usr/lib/;
       fi

       if [ -z "$ZMQ" ];   then  export  ZMQ=/usr/local;
       fi
       if [ -z "$ZMQINC" ];   then  export  ZMQINC=$ZMQ/include;
       fi
       if [ -z "$ZMQLIB" ];   then  export  ZMQLIB=$ZMQ/lib;
       fi


       if [ -z "$TROLLTECH" ]; then
         echo
         echo ====== do not use psi trolltech directories
         echo
         if [ -z "$QTDM_RPATH" ];   then export  QTDM_RPATH=${QTDM_LIBINSTALL}:${QTBASE};
         fi
       else
         echo
         echo ====== use psi trolltech directories
         echo
         if [ -z "$QTDM_RPATH" ];   then export  QTDM_RPATH=${QTDM_LIBINSTALL}:$TROLLTECH/binQt;
         fi
       fi

      if [ -z "$QTDM_RPATH" ];   then export  QTDM_RPATH=${QTDM_LIBINSTALL}:$TROLLTECH/binQt:${QTBASE};
      fi
Example build settings for Rocky Linux 9#
    dnf -y install epel-release
    dnf install qt-creator
    dnf install readline-devel
    dnf install perl
    dnf install qwt-qt5-devel
    dnf install qt5-qttools-devel
    dnf install qt5-qtx11extras
    dnf install qt5-qttools-static
    dnf install libzip-devel
    dnf install zlib-devel
    dnf install python3-devel
    dnf install libXext-devel
Please change the qmake call in ./caQtDM_BuildAll to qmake-qt5 .. code-block:
:caption: configuration

       #!/bin/bash
       if [ -z "$QTHOME" ];                then export   QTHOME=/usr;
       fi
       if [ -z "$QWTHOME" ];               then export   QWTHOME=/usr;
       fi
       if [ -z "$QWTINCLUDE" ];            then export   QWTINCLUDE=/usr/include/qt5/qwt;
       fi
       if [ -z "$QWTLIB" ];                then export   QWTLIB=${QWTHOME}/lib;
       fi
       if [ -z "$QWTVERSION" ];            then export   QWTVERSION=6.1;
       fi
       # on unix library can be libqwt or libqwt-qt5 or ...
       if [ -z "$QWTLIBNAME" ];            then export   QWTLIBNAME=qwt-qt5;
       fi
       if [ -z "$EPICS_HOST_ARCH" ];       then export   EPICS_HOST_ARCH=linux-x86_64;
       fi
       if [ -z "$EPICS_BASE" ];            then export   EPICS_BASE=/home/helge/base-7.0.7;
       fi
       if [ -z "$EPICSINCLUDE" ];          then export   EPICSINCLUDE=${EPICS_BASE}/include;
       fi
       if [ -z "$EPICSLIB" ];              then  export  EPICSLIB=${EPICS_BASE}/lib/$EPICS_HOST_ARCH;
       fi
       if [ -z "$EPICS4LOCATION" ];         then  export  EPICS4LOCATION=/home/mezger/EPICS-CPP-4.6.0/
       fi
       if [ -z "$EPICSEXTENSIONS" ];     then  export  EPICSEXTENSIONS=/usr/local/epics/extensions;
       fi
       if [ -z "$QTCONTROLS_LIBS" ];       then export  QTCONTROLS_LIBS=`pwd`/caQtDM_Binaries;
       fi
       if [ -z "$CAQTDM_COLLECT" ];       then export  CAQTDM_COLLECT=`pwd`/caQtDM_Binaries;
       fi
       export  QTBASE=${QTCONTROLS_LIBS};

       if [ -z "$CAQTDM_CA_ARCHIVELIBS" ];       then export  CAQTDM_CA_ARCHIVELIBS=`pwd`/caQtDM_Binaries;
       fi
       if [ -z "$CAQTDM_LOGGING_ARCHIVELIBS" ];       then export  CAQTDM_LOGGING_ARCHIVELIBS=`pwd`/caQtDM_Binaries;
       fi

       if [ -z "$QTDM_LIBINSTALL" ];  then  export  QTDM_LIBINSTALL=$EPICSEXTENSIONS/lib/$EPICS_HOST_ARCH;
       fi
       if [ -z "$QTDM_BININSTALL" ];   then  export  QTDM_BININSTALL=$EPICSEXTENSIONS/bin/$EPICS_HOST_ARCH;
       fi

       if [ -z "$PYTHONVERSION" ];   then  export  PYTHONVERSION=3.9;
       fi
       if [ -z "$PYTHONINCLUDE" ];   then  export  PYTHONINCLUDE=/usr/include/python$PYTHONVERSION;
       fi
       if [ -z "$PYTHONLIB" ];   then  export  PYTHONLIB=/usr/lib/;
       fi

       if [ -z "$ZMQ" ];   then  export  ZMQ=/usr/local;
       fi
       if [ -z "$ZMQINC" ];   then  export  ZMQINC=$ZMQ/include;
       fi
       if [ -z "$ZMQLIB" ];   then  export  ZMQLIB=$ZMQ/lib;
       fi


       if [ -z "$TROLLTECH" ]; then
         echo
         echo ====== do not use psi trolltech directories
         echo
         if [ -z "$QTDM_RPATH" ];   then export  QTDM_RPATH=${QTDM_LIBINSTALL}:${QTBASE};
         fi
       else
         echo
         echo ====== use psi trolltech directories
         echo
         if [ -z "$QTDM_RPATH" ];   then export  QTDM_RPATH=${QTDM_LIBINSTALL}:$TROLLTECH/binQt;
         fi
       fi

      if [ -z "$QTDM_RPATH" ];   then export  QTDM_RPATH=${QTDM_LIBINSTALL}:$TROLLTECH/binQt:${QTBASE};
      fi
Development history#
The following list describe the new features and bug fixes for every release. You can follow the development history and detect if a bug in the used version has been solved.
4.5.0
special character feature handling by CAQTDM_CUSTOM_UNIT_REPLACMETS
caStripplot improved data handling
optimized UI loading by reducing the load of incoming data (CAQTDM_SUPPRESS_UPDATES_ONLOAD)
improved colors in caQtDM status window
added UI loading benchmark
added the new archiverhttp-protocol
some code refurbishments
RPM for RHEL9
logfile generation for status window (CAQTDM_CREATE_LOGFILE,CAQTDM_LOGFILE_PATH)
small documentation updates
4.4.1
caQtDM can be compiled with Qt6
new signals for caCartesianplot
fix for caInclude with upscaling
fix for undefined macros to define a standard value in macro
fix for popup panels to get a panel without data monitors
fix for caLineEdit and caTextEntry to handle strings with Signal/Slot
fix for the start screen on some mobile iOS devices
cleanup of data plugin messages
fix for Qt6.4 compiler settings with EPICS4 header on Windows
fix the PV data selector in designer, missed environment
4.4.0
fileopenwindow: options changes
fix for converted adl files
fix for higher python versions
fix cacartesianplot for minor ticks disappeared when changing number of ticks
searchpaths handling for non ADL files
catable fix for big numbers
bsread fix null number counting messages
epics3plugin fix for disconnected channels
epics4plugin is now working with the epics 7 API and PVA can be used
filter feature for epics 7 is now available
caStripPlot: feature dynamic property “Legend” for rename the channel to a user defined
PV-Editor for Designer with network based auto completion
new command line option [-savetoimage] to save screenshots as PNG files
added C entry points for python
new decoding functions for camera images (Mono8,Mono10p,Mono10packed,Mono12p,Mono12packed)
future use of compression for camera images (zLib+jpg)
MacOS and iOS: Binaries already build with Qt6 Branch. The Reason is the dependency to the build environment
4.3.0
POPUP status windows with possible delays
dynamic Property caqtdmPopupUI and caqtdmPopupUI_Delay for POPUP windows (The filename must contain the word popup.ui)
wmsignalpropergator can resize a panel
fix for too long strings in channel names
fix for some character problems
fix for alarm status for caMenu
fix for softPV Waveform Processing
fix for softPV initialisation, wrong initial value, ui loader depending
cleanup in the sf-archiver
fix in caMenu, paintEvent removed
more file status check before accessing (avoid AFS problems)
fix the seg fault for the classname problem EPushButton
softPV vector/scalar performance problem fixed
start of EPICS 4 to EPICS 7 implementation
fix for string length problems
calinedraw emit textChanged
optimized caCalc signal emitance
caCamera add slots for zoom and position
caQtDM can be compiled with VS2019
Updates for Android and IOS
fixes some problems with MOC and QWT
build in ADL and EDL Parser
shellcommand for Mac
landscape version for Android
fileopening with dynamic conversion causes problems using TEMP directory
added for archivSF the redirection feature to access multiple data sources
fix a floating point problem on RHL7 in the archiveSF
two additional data plugins
4.2.4
fixed a exception in bsread at closing
added a userdefined format to caLinEdit,caTextEntry and caTextEntry
add macroreplacment for tooltip and statustip on: caLineEdit, caMultilineString, caGraphics, caPolyline, caMessageButton and caLed
fix TLS problem in sf archiver for old Qt Versions
buffer overflow in sf_archiver plugin corrected
extend macro replacement for cascript button
reusing connected channels in epics3 plugin for seting data
borderWidth designer problem with numbers >1, fixed
changes for python3
fix for backend check. Backend property will generate a message that the backend name is not known. but it will use it.
too strict check on RegEx match for visibility
caTextEntry value could be set beyond channel hopr or lopr limits. this has been corrected
focus can be kept now in caTextEntry even on pointer leave by specifying a property
instead of exchanging through shared memory directly for -attach, a queue has been integrated for attaching
for caLineEdit in case of bsread, the unit will be acquired automatically through epics (PSI special)
remove extra white spaces and special characters (lf, cr) form macrodefs
added for caTextEntry a drop possibility when dragging into it.
new bsread options
in the unit, the u in uJ will be converted to a real mu
4.2.2
shared memory key was not set correctly for -attach; corrected now
4.2.1
after write epics channel is cleared now
performance enhancement for caCalc
added some signals and slots
internal macros added
added property to caCartesianplot for changing size of symbols by a multiplicator
bug fixes
4.2.0
major changes in camera widget to support all possible epics data modes and camera modes
rich text now also considered for fontscaling
epics version number will now be printed in the message window
added include definition for epics 3.15 and higher
prevent too many messages when epics exceptions
bsread support for 2D waveforms
added ctrl+ and ctrl - to increase or decrease window size
added a slot for executing the message button
unresolved macros window implemented
the problem of increasing open files solved
added possibility to disconnect all channels in hidden tabs
problem with autoscale and infinite values solved
month number in date corrected
soft variables were not always updating. eliminated test for update; soft variables will not be updated in hidden tab
4.1.7
cawavetable was not expanding anymore; corrected
patch for Qt4.6
made a performance increase for cacalc, but still has to be carefully tested
added possible to get info for objects when the overlay widget has no monitors
4.1.6
added to print date, time and filename
added signals to cachoice, camessage so that setting of the index of a tabwidget will be possible
changed all floats in archive plugins to doubles in order to get a better resolution of the time axis
access security had a small bug when over a gateway
command line option updatetype=direct added to set caQtDM in direct update mode
camenu maske integriert, allows to make entries invisible
cathermo marker has now variable size
cursor shape did not change when on a cawidget and when access security changed
regex expressions now possible when using a macro
last index in array was not taken into account and scale was not updated for the wareerfallplot
optimization of archive plugins
added the possibility to update QtabWidget tab texts with a macro
changed padding for bigger fonts in carowcolmenu
added the possibility to modify colors of cacalc
resize storming of carowcolmenu solved
cascriptbutton got a property to hide the checkbox
QTextBrowser can now also display afile speicied with an url in the searchpath (see texts.ui)
a hide/show slot has been added to the ca widgets
the wmsignalpropagator got signals to propagate the resizing factor of a window. this can be used in order to correct animations with absolute pixel positions.
when propagating through a signal a value to cacalc, this value is displayed. However was not propgated for further use. This has been corrected
the colors of the caspinbox could be wrong due to a ack of proper initialisation, this has been corrected.
very big doubles were not set correctly, this has been corrected.
static visibility (while no channels) can be used now.
handle double encoded url’s in camimedisplay.
added hide/show slot in all ca widgets (permits to hide and show a widget when propagating a signal from cacalc)
when using waveforms from the archive, flashing of the cacartesianplot is suppressed when no data.
added propagation of signal QRECT to parent, this allows to move a cainclude
absolute positioning of items added to cainclude; abolute positions can also be channels that can move the positions.
due to some changes to internal stylesheet, the carelateddisplay could not be hidden, this has been corrected
x scale of cartesian plot can now also be used with a time scale (milliseconds from epoch)
for visibilitycalc, when no channels specified, static calculation will be done at startup
archive retrieval revisited, while crashing and http requests had to be canceled at exit.
added check for when git not present
added an environment variable CAQTD_TIMEOUT_HOURS to be used to quit caQtDM automatically, mouse event will reset the timeout.
it is now possible to use caCalc as a vector (waveform) by specifying associated pv’s. the soft variable can then be used to display a waveform
4.1.5
possibility to add a frame around a caInclude
in case of epics 3.15 added DBE_PROPERTY
modified caQtDM.pri for macos
modified caLineEdit and caLineDraw for displaying long long instead of long when double to integer representation
caled circle will stay a circle when resizing with another aspect ration; border color can be customized
add vumeter simulation to caThermo
calineargauge made correct size when no scale (in order to make all sizes the same)
for caRelatedDisplay one can now set the position for the called window
for caThermo a problem solved in case of alarm colors (not always refreshed with right color) and transparency added for background
for caThermo offset of 4 pixels modified in case of noscale
added horizontal and vertical spacing properties to caInclude
added possibility to modify position and size of a control object by the function %QRect in caCalc using 1 to 4 channels
loading of files through internet now also over https
again compatible with Qt4.6
cachoice bug when using bit offset corrected
legend added to cacartesianplot
calineargauge and cacirculargauge modifier in indor to be smaller and changed font algorithme.
added possibility to have another http address for archiveSF
added test to indicate that waveforms are not supported by the archive plugins.
archive plugins added
epics4 plugin finalized for normative types, thanks to Marty Kraimer
window management widget implemented (close window, …)
careplacemacro widget implemented; allows to redefine macros during runtime
utilities designer plugin added for widgets not directly related to the control system
X/Y waveforms implemented in camera view
bsread plugin developed by Helge Brands finalized
4.1.3
added for the cartesianplot resize of the fatdots plot
softpv treatment was slowing done caQtDM and is corrected now
camera has been more optimized for 16bit waveforms (the other types not yet, due to a lack of waveforms types)
label and vertical label can gave a border now
caChoice has now the possibility to display a row from the bottom to the top (rowInverse) and is optimized
soft pv’s without a name were not working, now automatically a name is generated
in order to have cacalc’s working correctly in includes, a macro can be used in order to individialize them
zero values in cartesian plot are now replaced by the lowest non-zero value when logarithmic scale is used
for infinite values, cartseian plot was taken unlimited resources for display, this should be corrected nw
slots are added to cagraphics for animation of these objects (tilt angle, span angle, arc, .. can be set now through signals
caCamera will now zoom by default on the middle of the image and otherwise around the last clicked point
autorepeat on canumeric has been take out on request of the users
default timing of the timed update loop has now a lower internal rate, may still be changed by a json string
.ftvl field of epics is now used to distingues signed anand unsigned display in cawavetable
in pep file you may add now the keyword -minwidth to an item in order to define the minimum width of it (default value=100).
you can steer column width like that. also -comsize has been added for the comment to steer the fontsize.
cachoice has been slightly modified in order to grow instead of shrink (for pep files this was an issue)
searching of a pv for the infobox would find the pv independently of the associated plugin, giving therefore confusion
caLineDemo has been renamed in caLineDraw and is now able to draw vertically
cawavetable takes now information from channel.FTVL into account in order to define signed or unsigned data
added CTRL+C to camultinestring for copying to clipboard
4.1.0
caslider and cathermo can now display also a value; caslider got also the possibility to set distinctly the lower and upper limit
caQtDM will now display mu and grad on all platforms
adapted cathermo and caslider so that it can take ito account a default style with fore and background colors; now Alarm is modified in Alarm_Default or Alarm_static
now a widget can be added (see caLineDemo) without having to change caQtDM_lib. An interface has been defined in order to perform the datacuisition inside the widget class.
caLineDemo widget is an example for a fast on QWidget based line monitor
caMimeDisplay will now take macros into account
fatDots implemented in cartesian plot
more optimized image display
tab order and focus considered
trailing zeros of caspinbox and cawheelswitch suppressed
toggle button for a soft pv was not working
caQtDM uses now qwt6.1.1 in order to take advantage of multicore processing
carowcolmenu performance enhancement
options -url and -emptycache added
shortcuts defined (Ex: Ctrl+R = reload window; Ctrl+Alt+R = reload all windows; Ctrl+O = Open File; Ctrl+P = Print)
stylesheet entry for most of the cawidgets has been suppressed and for many cawidgets the influence of an external stylesheet can only be changed when setting default colormode
it is now possible to pipe ui data to caQtDM
reload management had to be changed due to some Qt memory management problem
eliminated some memory leaks
corrected wavetable string crash
one can now define if the size of an included ui file will be size adjusted or not
cabyte, cabytecontroller performance were bad and has to be be corrected
camenu and catogglebutton color handling is now done by stylesheet and not with palette colors. This in order to prevent cascading stylesheets, that have precedence over palette colors, to interfere.
default property for label set to transparent color
window for included filenames shows now the number of times and average loadtime for loading.
4.0.2
new options on command line available for caQtDM: -cs for specifiying default plugin to be used, -options for passing options (key, value pairs) to plugins
use now the QStringlList editor in Designer for semicolon separated strings
mobile handling of config files slightly modified
adjustment of fonts for android modified / apply button of caapplynumeric is now resizable
resizing was perturbed by a resize forced by incoming channel data.
the vertical label has now an alignment property
cacartesianplot was not always well triggered when a trigger channel was specified, now corrected
camimebutton added in order to start applications defined through the file extension
cawavetable can now adapt its rows and columns automatically when zero is specified.
an enum can be display in calineedit as number when enumeric is specified as format (otherwise as string in all cases)
a multistring widget has been added to display waveforms with chars and strings (in case of chars a n will make a new line)
initialisation of the first stripplot values with nan instead of zero. Value zero was confusing.
added the possibility to clear the messages through the file menu
in case of -attach with a huge macro, the shared memory was designed too small. now 2 kBytes can be transferred
camultilinestring has been implemented in order to mainly display char waveforms where carriage returns (ascii code 13) will produce a new line
cameter was not updating its label for Qt5; this has been corrected
some possible buffer overrun conditions corrected
one can choose now the number of divisions for x on castripplot
tooltip for properties are now present in psi patched version of Qt4.8.2 and for Qt5.6.0 and higher
tooltip for caQtDM objects will integrate the tooltip given by the designer
signal emit of cacalc has now also its integer and double value (this way you can for example switch the tabwidget pages with a cacalc that is updated by a soft/real channel)
pep emulation has been updated by cosylab
some slots have been added in order to link signals and slots in designer
QStackedWidget will also optimize its io for visible/hidden tabs
color handling for calineedit has been slightly changed in order to be able to get white on red in case of a major alarm (wanted for pep handling)
cartesianplots have now a group property in order to be able to align the horizontal scale (vertical label rectangle gets same width)
when a pep file and an ui file were displayed by caQtDM, some resize problems and a problem with capolyline was detected; is now solved
cainclude can handle now multiple instances of the same file in column, row or rowcolumn mode and use for each instance another macro
4.0.0
caQtDM has now a controlsystem plugin structure. CS can be added by writing a plugin (see demo plugin) that will automatically be loaded. By specifying the plugin in front
of the pv name (i.e epics3://somepv) that plugin will then be used.
fixed a small problem while writing a string to epics (could crash)
the build files have been simplified
edl2ui enhanced (by Lucas Carvalho)
several warnings (mainly on mac osx) solved
capolyline was not resizing correctly, this has been now corrected
a string containing a semicolon was only displayed up to the semicolon, this is corrected now.
cacamera and cascan2d got display of selected values and readback values with different representations and may therefore write values to the CS
soft variable bug corrected (was not always found when writing)
catextentry got input dialogs (filedialog in case of strings, otherwise simple dialog)
activ widgets were always brought in front. Now you can choose if you let the designer define the layer
QTextBrowser can be used with macro substitution. The file that will be read in, will be watched for changes and will automatically be reloaded
a vertical label has been implemented
3.9.4
caQtDM will now also download from http when CAQTDM_URL_DISPLAY_PATH is defined
When starting with the option -httpconfig you will get the configuration screen in order to use network files as in mobile apps.
macros can now also be read when specifying -macrodefs filename
caMessageButton can be disabled/enabled by a second channel
configdialog for http configuration slightly changed
Zai added some edl objects
added cabytecontroller,for reading and setting individual bits
camenu: prevented scrolling of menu with mouse scroll while it interferes with scrollareas
changed default direction of caByte in parser.c in order to be compatible with MEDM
softpv name can now contain a macro
added calc string to info window * severity of a char/string record was not considered and is corrected, Char waveforms longer as 1024 were not displayed in calineedit and is corrected.
softpv’s in include file enabled
more colortables for caCamera, caScan2D, caWaterfallPlot
caScan2D added
added a clock allowing to display normal time or reception time of a process variable; alarm handling can be enabled to colorize the clock
added a new dial
problem with soft pv corrected
QTextBrowser can be used with macros in order to dynamically load files for display them in this textbrowser
modified the configdialog for ios and android
prevent caQtDM from crashing when maxvalue and minvalue have the same value.
for some images, the last row was missing and is corrected now
3.9.2
severity of a char/string record was not considered and is corrected, Char waveforms longer as 1024 were not displayed in calineedit and is corrected.
in edl2ui zais addons were integrated
softpv’s in include file enabled
more colortables for caCamera, caScan2D, caWaterfallPlot
caScan2D added
3.9.1
added a clock allowing to display normal time or reception time of a process variable; alarm handling can be enabled to colorize the clock
added a new dial
problem with soft pv corrected
QTextBrowser can be used with macros in order to dynamically load files for display them in this textbrowser
modified the configdialog for ios and android
prevent caQtDM from crashing when maxvalue and minvalue have the same value.
for some images, the last row was missing and is corrected now
3.8.10
caStripPlot was eating the CPU and has been optimized; refreshrate (low, medium, high) has been introduced, so that it can be adjusted by the user
some crash conditions eliminated
3.8.9
change for g++ 4.4.7
pixmaps on buttons are now rescaled
modified cawavetable to display as matrix with a finite number of elements; elements can be modified and representation choosen
caWaveTable can display now values as decimal, string, hex and octal
on ipad the slider click and tapandhold interfered, this has been solved
on ipad the autorepeat option of the wheelswitch has been disabled while interfering with tapandhold
on ipad it is possible now to give multiple ip addresses in the EPICS_CA_ADDR_LIST separated by blancs
eliminated some warnings
test for null pointers added in case of absence of channels
resizing of caTable and caWaveTable has been changed
3.7.2
cagraphic lost its linecolor after no connection, corrected
calineedit was not showing alarm colors in alarm_default mode, corrected
3.7.1
improved performance for cartesian and waterfall plot; very long arrays can be displayed
zoom in cartesian plot was not working well for small values and has been corrected
epics request for arrays (ca_add_array_event) changed to a request for 0 elements in order to get the arrays with their actual length
added properties to caLineEdit in order to be able to make a framed border
3.7.0
a spinbox has been integrated in order to be smaller than the wheelswitch. for the spinbox the digit has to be activated by clicking in order to change it.
strings in caLineEdit were trimmed; took that out
selection in caTable can be rows or columns now, caTable can execute a specified script with the associated pv
eliminated sending message in caMessage with right button of mouse.
3.6.4
an empty char waveform was not clearing the caLineEdit: corrected
enums with empty strings were not displaying correctly in caLineEdit
when reloading a .prc file, size of display was not minimized
default back and foreground colors can be set now for caLineEdit/caTextEntry in ui-file stylesheet of mainwindow or in stylesheet.qss
negative precision was leading to an unexpected behaviour, caLineEdit will use the precision and switch to exponential display
spacebar press has been suppressed for caMessageButton, caShellCommand, caRelatedDisplay, caRowcolMenu, caChoice
changed for caSlider and caNumeric the limits for channel to DRVL and DRVH
added to formread in prc file command and comlab modifiers
3.6.2
caCartesian plot and caStripPlot can have a logarithmic scale now
3.6.1
suppressed slidervaluecallback when setting limits from hopr, lopr
added a first attempt of a caWaterfall plot for waveforms
corrected for caCamera, position calculated when zooming to small images
in case of reload, data display is now stopped until all displays are loaded again
camera images can now be zoomed and scrolled
reset zoom for caCartesianPlot did not reset correctly in case of channel limits
added zoom mechanism for caCartesianPlot
added update mechanism choice in main menu in order to switch to direct monitoring or timed monitoring
starting performance optimized for caRelatedDisplay, caChoice, caMenu
splashscreen added for loading includes (in some cases loading time can be significant)
3.5.2
by using CAQTDM_EXEC_LIST as environment variable (as in MEDM with the same syntax), menu items can be added to the context menus
for caThermo in parser the look was not see as property and caThermo itself was initializing itself per default wrong
3.5.1
bug corrected when unfinished enum definition
slider was writing to epics on first call, now it does not
caPolyLine now does not extend its lines when linesize > 1 is used, reproducing the behaviour of MEDM
caThermo and caSlider resize handle and labels according to the size, foreground and background are working correctly now
however with qwt6.1.0 in qwt_slider the routine scaleDraw(); must be set protected instead of private as was in qwt6.0
3.5.0
caQtDM gives information now about number of monitors/s, number of displays/s and highest monitor
3.4.7
adapted caSlider for qwt6.1
3.4.6
corrected a bug for caGauge with alarms no
use control key for amplifying 10x the increment
3.4.5
caSlider has now a menu to change its increment, in designer increment can be specified to
caSlider moves also on left mouse click and an wheel scroll; when it has the focus, up and down keys can be used (when focus outline red gets drawn)
gauges have now following properties: alarmLimits : Channel_Alarms, User_Alarms, None
displayLimits : Channel_Limits, User_Limits
adl2ui has been corrected for these properties
3.4.4
enhanced performance for caCamera widget
3.4.3
package can also be build with Qt4.6 and qwt6.0, necessary for SL6 (caCartesianplot, caDoubletabWidget and plugins slightly modified)
epics enums and strings modified for count > 1
3.4.2
caCamera stuff modified
added mutex to synchronize data and display
font bug in caTable solved
found a datarace in caStripplot, corrected
3.4.1
caCamera displays intensity at x, y
caCamera context menu for grey / spectrum and zoom
3.4.0
caStripplot has been revisited
caCamera uses now concurrent mode for calculations
3.3.1
mainwindow and messagewindow have been merged
3.3.0
caTable gets now the correct font after resizing when values update
caStripPlot has been corrected for incorrect time behaviour.
3.2.2
in menu you have the possibility to raise the main and message windows
3.2.1
when requesting a display that was already started, it did not popup but made a new instance. this has been corrected
this was working before, but by some modifications was not correct any more
3.2.0
The build mechanism for linux and windows should do on most platforms, see caQtDM_README
caQtDM build for qt4.8 with qwt6.0 and for qt5.1 with qwt6.1
caLed can use now the severity to colorize
caThermo was inadvertently using nodeco mode when mode was used
caCircularGauge will draw a white scale when not connected and bug corrected
for enums without enum string write just the value in caLineEdit
3.1.1
The main characteristic of this version is that you can resize the caQtDM synoptic display windows without using Qt layouts. You can build a display normally and everything will be resized when you resize the window.
In order to make the resizing correctly, you should specify for the fontscalemode of caLabel and caLineEdit the parameter “WidthAndHeight”.
When you convert MEDM displays with the utility adl2ui, this is done automatically.
When you do not want a window to be resized, you can specify -noResize on the command line.
Another enhancement existing since version 2.8 is the fact that you can hook a digit of the wheelswitch to the keyboard in order to modify it with the up and down keys.
2.8
All the changes have been documented in qtdefs.pri
2.5
Scales of Stripplot can now be changed during runtime. The caQtDM application normally limits the update rate of monitors to 5 Hz,
however now a JSON string can be written behind the channel name.
An example is given in the presentation “introduction to caQtDM”.
Color mode for calabel is now working (was forgotten). Also an icon is presented on the window bars.
A Windows distribution package allowing to work immediately with the designer and caQtDM has been build and can be downloaded here
(this package does not contain any sources, merely executables, work done by H.Brands at PSI).
2.3
Timebase of Stripplot was wrong and has been corrected. Some other compiler warnings have been eliminated and the building process was slightly modified.
2.1
When using correctly the layout possibilities offered by Qt, one can resize a window (you will find an example in
work/caQtDM/parser/proscanFiles/phaseslitsnew.ui).Up to now when using “includes” only a placeholder could be seen in the designer. Now the included ui file is displayed inside the designer.
For polylines and polygones, a graphical editor is integrated into the designer. One can create segments by pressing the left mouse button when moving the
mouse and one can delete the last created segment by pressing the right mouse button.
The graphical entities (rectangles, circles, ellipses, lines, arrows, triangles) can be rotated by specifying a tilt angle.
2.0
The major changes in this version are changes for stability (in the previous version sometimes crashes occurred) and the introduction
of soft pv’s. A variable can be defined, calculated and used as a normal pv.
All the features of medm used for the cartesian plots are implemented now. The caCartesian plot background can be transparent so that a camera image can be
underlaid. The limits of the x and y axes can be changed by specifiying pv’s instead of values when using channel limits. The stripplot widget has been
modified while the behaviour was not quite correct. The message button and textentry were not working well and have been corrected. Labels can be transparent too.
A camera widget has been introduced. At PSI we can now display are usual cameras bw and color. You can easily modify the code to treat other formats
of camera waveforms.
caQtDM gives the number of connected and unconnected channels, furthermore a list of unconnected channels with their file location can be shown.
caQtDM is now protected against ui description file syntax errors;
caQtDM supports the command line parameters -attach -noMsg -display -macro -x -noStyles -dg. -x has no effect but suppresses the error message when
keeping the medm command line parameters.
caQtDM runs in native mode on linux as well as on microsoft windows.
caQtDM Custom Widgets#
The custom widgets used in caQtDM have been divided into three categories, as done in MEDM. MEDM users are used to these categories and we have therefore kept the categorisation split up in Graphics, Controller and Monitors.
- Graphics:
Items such as frames, labels, graphical entities like rectangles, triangles, lines, …, images and composite objects (called here includes, because they are included from other
.uifiles.- Monitors:
Objects that monitor the state or values of process variables and display values, plots, tables, thermometers, dials, …
- Controllers:
Objects that change the values of process variables through many different objects. You will find an exact description of them with their properties here.
For all objects, you normally have their geometry (position and size),
size policy and some other properties like tooltips. It has to be noted
that for many widgets their stylesheet will be overwritten in order to
get the representation that is requested when specifying for example
background, foreground, border colors or other properties. The
stylesheet can be influenced in some cases by specifying a stylesheet
for the mainwindow or in stylesheet.qss, a stylesheet found in the
caQtDM path. The adl2ui converter normally uses this stylesheet to
integrate these defaults into the generated .ui file. You may delete
this stylesheet or change it to your convenience. However as mentioned
before, many styles will be overwritten.
Graphics |
Monitors |
Controllers |
|---|---|---|
caGraphics: Rectangle, Circle, Arc, Triangle, Line, Arrow |
||
caPolyLine: polyline and polygon |
||
caLabel: text |
||
caImage: any image format, mostly used for animated gifs |
||
caInclude: the equivalent to composite of MEDM |
||
caDoubleTabWidget: a general purpose widget |
||
Their main properties are described below. It must be noted that through inheritance of Objects other properties exist that are not necessarily relevant here.
all monitor objects#
caLineEdit, the most used graphical object for data monitoring#
is the equivalent of the Text Update in MEDM.
Geometry is used for any objectDescription:
- channel:
QString: this string represents the control system process variable
- foreground:
QColor: color used for the foreground
- background:
QColor: color used for the background
- colorMode:
Default
Show the object in colors given by stylesheets.
Static
Show the object in colors given by the properties background and foreground.
Alarm_Default
Show the object in alarm colors based on the severity of the associated process variable. (green, yellow, red, white or gray). The foregound or the background is given by the stylesheets depending on if alarmHandling specified that the alarm handling is done on the foreground or on the background.
Alarm
as Alarm_Default, but the foreground or background color is taken from the properties background or foreground
- framePresent:
boolean: specifies if a border will be drawn around the object, frameLineWidth must be different from zero in order to see the border
- frameColor:
QColor: color used for the border
- frameLineWidth:
Integer: linewidth of the border
- alarmHandling:
when colormode is set to alarm, it can be specified here if the foreground or the background will show alarm colors.
- precision:
Integer: precision in case of precisionMode=User
- precisionMode:
Channel
Precision specified by the control system will be used
User
Precision specified by the user will be used
- limitsMode:
Channel
Limits specified by the control system will be used (HOPR, LOPR for EPICS)
User
Limits specified by the user will be used.
- maxValue:
float: maximum value used in case of limitsMode=User
- minValue:
float: minimum value used in case of limitsMode=User
- fontScaleMode:
None
No scaling will be done
Height
Text will be scaled to the height of its containing box
WidthAndHeight
Text will be scaled to the height and width of its scaling box; this should be used for a correct resizing of the display
- unitsEnabled:
boolean: when checked will append the unit to the value
- formatType:
decimal
value encoded in f format using precision from user or channel, in case of negative precision will switch to e format
exponential, engr_notation
value encoded in e format using absolaute precision from user or channel
compact
value encode in e or f format using absolaute precision from user or channel, format will switch to e format for values <1.0e-4
truncated, sexagesimal, sexagesimal_hms, sexagesimal_dms
not supported yet
hexadecimal
value will be encoded in hexadecimal format
octal
value will be encoded in octal format
string
will be treated as decimal format
caThermo#
is the equivalent of the Bar Monitor in MEDM.
Geometry is used for any objectDescription:
- channel:
QString: this string represents the control system process variable
- foreground:
QColor: color used for the foreground
- background:
QColor: color used for the background
- colorMode:
Default
Show the object in colors given by stylesheets.
Static
Show the object in colors given by the properties background and foreground.
Alarm
Show the object in colors given by the properties background and foreground, but change the color of the pipe in case of alarm
- direction:
Up, Down, Left, Right
- look:
noLabel, noDeco, Outline, Limits, ChannelV; These property values are for compatibility with MEDM, and should be implemented later. Actually Outline, Limits and ChannelV will give you a scale when scalePosition is different from noScale; noLabel and noDeco will have no scale.
- logScale:
boolean: true or false
- limitsMode:
Channel
Limits specified by the control system will be usd (HOPR, LOPR for EPICS)
User
Limits specified by the user will be used.
- type:
Pipe, marker, PipefromCenter
- scalePosition:
Noscale, LeftScale, RightScale, TopScale, Bottomscale
- maxValue:
float: maximum value used in case of limitsMode=User
- minValue:
float: minimum value used in case of limitsMode=User
caLed#
has no equivalent in MEDM.
Geometry is used for any objectDescription:
- channel:
QString: this string represents the control system process variable
- bitNr:
Integer: the bit that has to be considered
- falseColor:
QColor: color used when the bit is not set
- trueColor:
QColor: color used when the bit is set
- colorMode:
Static
Show the object in colors given by the properties background and foreground.
Alarm
Show the object in colors given by the properties background and foreground, but with alarm handling
caLinearGauge#
is the equivalent of the Bar Monitor in MEDM.
Geometry is used for any object Description:
caCircularGauge#
is the equivalent of the Meter Monitor in MEDM.
Geometry is used for any object Description:
caCartesianPlot#
is the equivalent of the Cartesian plot in MEDM and will plot up to 6 curves
Geometry is used for any objectDescription:
- Title
QString: Titel of the plot
- TitleX
QString: Title of the X-axis
- TitleY
QString: Title of the Y-axis
- channels_1, channels_2, channels_3, channels_4, channels_5, channels_6
QString: these strings represent the control system process variables; each channelpair is composed of two channels separated by a semicolon. When specifying only one channel, you will have to put a semicolon in fron or at the end of the string in order to specify x or y. In the table below you will find how the cartesian plot behaves in case of array or scalars or when only one channel is specified.
- Style_1, Style_2, Style_3, Style_4, Style_5, Style_6:
NoCurve
no curve, symbols will only be drawn if they are specified
Lines
normal curve drawn with lines
Sticks
curve drawn with sticks from the x base
Steps
curve drawn with steps
Dots
curve with only dots drawn
FillUnder
curve will be filled from the x base
ThinLines
curve draw with thin lines
HorSticks
curve drawn with sticks from the y base
- symbol_1, symbol_2, symbol_3, symbol_4, symbol_5, symbol_6:
NoSymbol
no symbol will be drawn
Ellipse
Diamond
Triangle
DTriangle
UTriangle
LTriangle
RTriangle
Cross
XCross
HLine
VLine
Star1
Star2
Hexagon
- color_1, color_2, color_3, color_4, color_5, color_6:
QColor: color used for the curve
- countNumOrChannel
QString: The Count for the Cartesian Plot may be an integer or the name of a process variable. If the value starts with a non-digit, then it is considered to be a process variable name, and the value of Count will come from the process variable. If the process variable is not found or its value is less than 1, Count will not be executed
- triggerChannel
QString: The Trigger Channel is a process variable that causes the entire plot to be updated. If there is a trigger channel, the plot is updated whenever the value of that process variable changes. Otherwise, each individual trace is updated whenever any of the data for that trace changes.
- eraseChannel
QString: The Erase Channel is a process variable that causes erasing of the plot. If there is an Erase Channel, the plot erases when the process variable turns either zero or non-zero, depending on the Erase Mode . The Erase Mode is only relevant if there is an erase channel.
- eraseMode:
ifnotzero
Erase the plot if the erase-channel process variable is not zero
ifzero
Erase the plot if the erase-channel process variable is zero
- plotMode:
PlotNPointsAndStop
Plot n points corresponding to the first n changes of the process variable, then do not plot any more points
PlotLastNPoints
Plot n points corresponding to the last n changes of the process variable, overwriting previous points.
- XaxisType/YaxisType:
linear
Use a linear axis
log10
Use a logarithmic axis to the base 10
- XaxisScaling/YaxisScaling:
Auto
Let the graph routine decide on the axis range depending on the data
Channel
Get the axis range from the process variable
User
Specify custom minimum and maximum values for the axis
- background:
QColor: color used for the background
- foreground:
QColor: color used for the foreground
- scaleColor:
QColor: color used for the scale if scales are specified
- gridColor:
QColor: color used for the grid if grid is specified
- XaxisEnabled:
bool: specifies if the x axis should be drawn
- YaxisEnabled:
bool: specifies if the y axis should be drawn
- grid:
bool: specifies if a grid should be drawn
- XaxisLimits:
QString: minimum value used in case of limitsMode=User; the values must be separated by a semicolon
- YaxisLimits:
QString: minimum value used in case of limitsMode=User; the values must be separated by a semicolon
In caQtDM the curve can be zoomed in on with the mouse by pressing the left mouse button and selecting the area that has to be zoomed. The area is shown by a rubberband rectangle. Reset zoom can be chosen through the context menu. Translation can be done by pressing the middle mouse button and moving the mouse. Pressing the right mouse button will bring up a context menu (for pvInfo, resetting zoom and changing axes) A caQtDM Cartesian Plot has the same conventions as a MEDM Cartesian Plot. This plot is a very important tool used in control systems and its behaviour was taken from MEDM. The Cartesian consists of an X and one or two Y axes on which data can be plotted. The sets of data are called traces and consist of a set of (x, y) pairs with the properties shown above. The traces correspond to curves on the plot. Currently there can be up to six traces on a plot. Each trace can (but does not have to) have a process variable from which to get the x values and another from which to get the y values. These process variables can be array process variables, such as Waveforms, or they can be scalar process variables with only a single value. The variables have to be separated by a semicolon (see above). There are eight possible kinds of traces as seen in the following table. The traces for a given plot do not have to be all of the same kind - they can be mixed. (In the table Nx is the number of elements in the process variable specified for x, and Ny is the number of elements in the process variable specified for y. The letter n denotes a number greater than one, and a blank indicates no process variable is specified. The axis limits LOPR and HOPR denote the limits obtained from Channel Access for the process variable. Typically, these are the fields LOPR and HOPR in the associated record, but can be specified by the user with the properties XaxisScaling and YaxisScaling. Count is the specified Count for the Cartesian Plot, which is described in more detail below.)
Kinds of XY Traces
Nx
Ny
Type
Points
Xmin
Xmax
Ymin
Ymax
NPoints
n
n
X,Y Vector
x(i),y(i)
LOPR
HOPR
LOPR
HOPR
Min(Nx, Ny)
n
1
X Vector, Y Scalar
x(i),y
LOPR
HOPR
LOPR
HOPR
Nx
1
n
Y Vector, X Scalar
x, y(i)
LOPR
HOPR
LOPR
HOPR
Ny
n
X Vector
x(i),i
LOPR
HOPR
0
Count - 1
Nx
n
Y Vector
i,y(i)
0
Count - 1
LOPR
HOPR
Ny
1
1
X,Y Scalar
x(i),y(i)
LOPR
HOPR
LOPR
HOPR
Count
1
X Scalar
x(i),i
x(i),i
LOPR
HOPR
0
Count - 1
1
Y Scalar
i,y(i)
0
Count - 1
LOPR
HOPR
Count
If one of the process variables is an array with more than one element and if Count is a number greater than zero, the specified Count is ignored and the value shown in the last column of the table is used. Under the same circumstances, if Count is a name, then it is used only if it is greater than 0 and less than what would be used if it were a number. That is, Count from a process variable can only restrict NPoints to a lower number than it would be otherwise. The points are plotted from i = 0 to NPoints - 1 and update as the values change. In the cases where one of the process variables is not specified, the history is plotted on that axis against values from 0 to NPoints - 1 on the other axis.
If one of the process variables is an array with more than one element and the CA server of the process variable supports dynamic arrays, then when a zero is specified for Count, the number of array elements will be set to the current number of valid elements in the array which may vary with subsequent array update events. In the remaining cases, where neither process variable is an array with more than one element, Count corresponds to a history of the process variable. (These are the cases where NPoints is shown as Count in the table.) Each time the process variable changes (or when either one changes, in the case of X, Y Scalar) a new point is plotted until there are Count points. The points are plotted from i = 0 to the lesser of Count -1 and the number of updates. When the Plot Mode is “PlotNPointsAndStop”, no more points are plotted. When the Plot Mode is “PlotLastNPoints”, the earliest point is discarded and the others are moved down, and the latest is plotted at the end. In the cases where one of the process variables is not specified, the history is plotted on that axis against values from 0 to Count - 1 on the other axis.
The above behaviour still has to be tested thoroughly. It appeared already that perhaps Count must be twice the value described above?
caStripPlot#
This serves as the replacement for the StripChart Monitor in MEDM.
Geometry is used for any objectDescription:The caStripPlot widget can display up to 7 simultaneous curves on a plot. Every curve gets it’s data by an EPICS pv. The data comes in the form of doubles, indicating the y values. The x values are automatically calculated by either taking the time a value was received or by setting a static value based on XaxisType. The caStripPlot can either display the values on a logarithmic scale to the base 10 or on a linear scale. There are also 3 different ways the caStripPlot is scaled.
It can have fixed limits (minimum and maximum) using the fixedScale feature. You can have multiple curves, even with different limits; therefore the y-axis can only display the limits of one curve at a time. By default, the limits of the first curve are displayed. The other curves still have their original limits and their points are drawn like the y-axis had the corresponding limits. Only the y-axis doesn’t look like it. Because of that, you can cycle through the curves whose limits are displayed on the y-axis, either with the Property CurvesIterableInLegend or with CurvesSelectableInPlot or by using one of the slots described below. Due to backwards compatibility, any features that select a different curve to dispay it’s limits are disabled by default. The currently displayed axis is indicated by coloring the axis in the color of the represented curve and by underlining the channel name for this curve in the legend.
The caStripPlot can also dynamically calculate the limits itself by using the autoScale or selectiveAutoScale feature. With autoScale, the caStripPlot analyzes all currently drawn points on all curves and adjusts the limits to fit all curves in the plot entirely. Because this might cause the plot to be unreadable if one curve has extremely high or low spikes, selectiveAutoScale can be used instead to be able to deselect single curves from being taken into consideration when calculating the new limits. Curves can be deselected in the “change axis” menu accessible through the context menu by right-clicking the plot. In this menu, the scaling can also be selected, just as the y-axis type (linear or log10) and the limits for all curves. Additionally, because negative values on one curve can completely distort a logarithmic scale on autoScale, there is an extra option for this specific problem. If the scale is both autoScale and logarithmic, a field will appear in the “change axis” menu, where a custom minimum value can be defined for the plot. One important thing to consider is that even though the y-axis limits only display for one curve at a time with fixedScale, in autoScale the y-axis limits are correctly displayed for all curves, as then they all have the same, automatically computed limits. This is also why you cant change the y-axis to be displayed with autoScale or selectiveAutoScale, because there is only one.
You can also freeze the image currently drawn in the plot by pausing and resuming it using the provided public slots. You can also restart the plot if you want to clear it or if graphical mistakes happen you want to erase.
With the property plotpicker activated, a field will appear upon hovering over the plot, giving information about the point your cursor is currently on. It will display the x- and y-axis values, so it can be easily spotted which value a curve had at a certain time. But remember: The y-data is for the first curve only, the others might have different y-values there. To see their value, the displayed y-axis has to be switched first.
- Title
QString: Titel of the plot
- TitleX
QString: Title of the X-axis
- TitleY
QString: Title of the Y-axis
- channelsList
QString: this string represents the control system process variables; the channels have to be separated by a semicolon.
- units
Millisecond
The update period is in milliseconds.
second
The update period is in seconds.
minute
The update period is in minutes.
- period
Integer: the timespan of the plot for the specified units
- refreshRate
sets the refresh rate for the plot ======= ====================================== low The refresh rate is set to 2.5 Hz. medium The refresh rate is set to 5 Hz. high The refresh rate is set to 10 Hz. ======= ======================================
- XaxisType
ValueScale
The scale of the x-axis is given with the values based on the period value
TimeScale
The scale of the x-axis is given in the format hours:minutes:seconds
TimeScaleFix
- numberOfXticks
Integer: the number of ticks on the x-axis and therefore the number of horizontal grid lines.
- YAxisType:
linear
Use a linear y-axis
log10
Use a logarithmic y-axis to the base 10
- YAxisScaling
fixedScale
The y-axis has fixed minimum and maximum values that are dependent on YaxisScaling{Max}_1 …..7
autoScale
The y-axis minimum and maximum values are dynamically selected to fit every curve with some margin
selectiveAutoScale
Does the same as autoScale, but single curves can be deselected in the context menu so the plot only fits selected curves. Can be used to prevent spikes in one curve from distorting the min/max values for the plot
- plotpicker:
off
PlotPicker utility is disabled
on
PlotPicker window with plot information will display when hovering over the plot
- CurvesIterableInLegend:
- bool: when activated, left-clicking the legend will cycle through the different axis limits to display on the y-axis
Important: This feature only works with YAxisScaling=fixedScale
- CurvesSelectableInPlot:
- bool: when activated, left-clicking on a curve in the plot will select its limits to display on the y-axis
Important: This feature only works with YAxisScaling=fixedScale
- YaxisLimitsMax_1 …..7/YaxisLimitsMin_1 …..7:
QString: minimum/maximum value used in case of YaxisScaling{Min/Max}_1 …..7=User
- YaxisScalingMax_1 …..7/YaxisScalingMin_1, …..7:
Channel
Get the axis range from the process variable
User
Specify custom minimum and maximum values for the axis.
- Style_1 ….7:
Lines
normal curve, like a line
FillUnder
curve will be filled from the x base
- color_1 ….7:
QColor: color used for the curve
- foreground:
QColor: color used for the foreground
- background:
QColor: color used for the background
- scaleColor:
QColor: color used for the scale if scales are specified
- grid:
bool: specifies if the grid should be drawn
- gridColor:
QColor: color used for the grid if grid is specified
- XaxisEnabled:
bool: specifies if the x-axis should be drawn
- YaxisEnabled:
bool: specifies if the y-axis should be drawn
- LegendEnabled:
bool: specifies if the legend should be drawn
Dynamic Properties: container:: caStripPlot also has dynamic properties. For panel designers, they can be treated the same as regular QProperties.xAxisToleranceFactor: double: value between (not equal to) 0 - 1 defining the tolerance factor for selecting curves in the plot when CurvesSelectableInPlot is set to true. When the plot is clicked, the period in seconds is multiplied by the xAxisToleranceFactor. This new Value is used as the tolerance to determine if a click in the plot landed on a curve or not. Only clicks that have a point with an x-value deviating no more than this tolerance from the mouse click are registered. The curve it selects is the one with a point that is both within the x-axis tolerance and is the closest on the y-axis from all the points within the x-axis tolerance. In short: this property sets the accuracy of mouse clicks when selecting a curve by clicking in the plot, the default value is 0.01, creating a 1% tolerance. This property only has an effect if CurvesSelectableInPlot is set to true, otherwise no clicks in the plot are registered.
Public Slots:
- animation(QRect p):
Input: QRect: X = new X Coordinate, Y = new Y Coordinate
Slot to change the position of the plot. The X and Y Coordinates of the QRect are used to set the new coordinates of the plot. This can be used for example by creating a cacalc to output a QRect (with %QRect in “calc”, two channels in “channel” and “channelB” and onAnyChange in “eventSignal”) and then use the output signal as input for animation(QRect). In this example, every time one of the input channels changes, the caStripPlot is relocated to the new position.
- void hideObject(bool hideit):
Input: bool: false to show, true to hide
Slot to hide the whole caStripPlot widget. It still works in the background and registers new points, so don’t use this to load a lot of different variations of a plot, as they will all consume power and affect performance.
- stopPlot():
Input: nothing
Slot to stop the plot. This does the same as pausing it with the slot pausePlot, just that it only stops it, to resume it you have to use another slot.
- resumePlot():
Input: nothing
Slot to resume the plot when it is stopped. This does the same as resuming it with the slot pausePlot, just that it only resumes it if stopped by another slot.
- restartPlot():
Input: nothing
Slot to restart the plot. It clears the plot so the canvas empty and then starts tracing the curves again as they come in. Can be used to get rid of graphical errors on the plot or just to get an empty plot again.
- pausePlot(bool pausePlot):
Input: bool: true to pause the plot, false to resume it
Slot to pause and resume the plot with just one plot. Will freeze the plot, manipulations like displaying another y-axis are still possible to analyze the plot data. Disclaimer: This is meant for short pauses, it is recommended to resume the plot shortly after stopping. If the “apply” button is clicked in the “change axis” menu (reachable through context menu) the image might start to fade away, this action is possible but not supported as it overwrites the memory holding the paused plot data.
- selectFixedYAxis(int newYAxisIndex):
Input: integer: any value from 0 through 6 and no more than the index of the last curve in the plot, indicating a curve index
Slot to select a curve by index whose limits are displayed on the y-axis. So if the plot has 3 channels connected to curves 1, 2 and 3 then their index is 0, 1 and 2. By calling this slot with the integer 1, the limits of the second curve will be displayed in the y-axis. If this slot is called and the property YAxisScaling is not set to fixedScale, it will be set to fixedScale. The actions of this slot cannot be configured using a default property. The y-axis will by default display the limits of the first curve.
- setPlotPickerMode(int mode):
Input: integer: either 0 for off or 1 for on
Slot to disable or enable the plotpicker utility Does the same as setting the plotpicker property but can be dynamically called.
- setIterableCurves(bool itCurvs):
Input: bool: true to activate, false to deactivate
Slot to select whether the curve whose limits are displayed can be iterated over by clicking the plot legend. Does the same as setting the CurvesIterableInLegend property but can be dynamically called.
- setSelectableCurves(bool selectCurvs):
Input: bool: true to activate, false to deactivate
Slot to select whether the limits displayed on the y-axis can be selected by clicking a curve with the new limits in the plot. Does the same as setting the CurvesSelectableInPlot property but can be dynamically called.
void animation(QRect p) {
- #include “animationcode.h”
}
void hideObject(bool hideit) {
- #include “hideobjectcode.h”
}
void stopPlot(); void restartPlot(); void pausePlot(bool pausePlot);
void selectFixedYAxis(int newYAxisIndex);
void setPlotPickerMode(int mode);
void setIterableCurves(bool itCurvs) {thisIterableCurves = itCurvs; qDebug() << “signal it Called with bool:” << itCurvs;};
void setSelectableCurves(bool selectCurvs) {thisSelectableCurves = selectCurvs; qDebug() << “signal sel Called with bool:” << selectCurvs;};
caByte#
is the equivalent of the Byte Monitor in MEDM.
Geometry is used for any object Description:
caCamera#
Description: The main idea of the camera widget is to display 2D data in a widget. This can be any data that has the one format that the widget can decode. The widget uses EPICS data types, but can use the data as a memory bob and decodes the data in various ways that are common for image encoding. Be aware that we can’t implement every way. We tested against two different vendors/color cameras (Basler acA4600-10uc/acA1300-30gc and Prosilica GC1660C) to cover most needed conversions. Be aware that the conversion matrixes between YUV and RGB are based on the used color room. We are using these functions:
- channelData
Image data channel. Typically a waveform with the data in different formats comming directly from the hardware.
- channelWidth
channel with the horizontal resolution in pixel
- channelHeight
channel with the vertical resolution in pixel
- simpleZoomedView
boolean to reduce the complexity of the widget to get an image only view
- Zoom
enables/disables the zoom bar on the right site of the widget
- automaticLevels
enables the scan over the image data to define the min and the max value. These values are needed to
- minLevel
define in the widget a static min level. This can be changed during runtime.
- maxLevel
define in the widget a static max level. This can be changed during runtime.
- colorMode
- Enum: how the data should be interpreted
Enum value
datatype
simple description
Mono
EPICS
data of the waveform used to generate the image from data defined in the EPICS data type
Mono12p
Binary
12 bit packed mono format
Mono10p
Binary
10 bit packed mono format (5 Byte)
Mono10Packed
Binary
10 bit packed mono format (3 Byte)
Mono8
Binary
8 bit mono data
RGB1_CA
EPICS
3 Layer RGB data pixel by pixel
RGB2_CA
EPICS
3 Layer RGB data line by line
RGB3_CA
EPICS
3 Layer RGB data image by image
BayerRG_8
Binary
8 bit Bayerpatternformat RGB
BayerGB_8
Binary
8 bit Bayerpatternformat GBR
BayerGR_8
Binary
8 bit Bayerpatternformat GRB
BayerBG_8
Binary
8 bit Bayerpatternformat BGR
BayerRG_12
Binary
12 bit Bayerpatternformat RGB
BayerGB_12
Binary
12 bit Bayerpatternformat GBR
BayerGR_12
Binary
12 bit Bayerpatternformat GRB
BayerBG_12
Binary
12 bit Bayerpatternformat BGR
RGB_8
Binary
8 bit RGB data
BGR_8
Binary
8 bit BGR data
RGBA_8
Binary
8 bit RGBA data
BGRA_8
Binary
8 bit BGRA data
YUV444
Binary
converted data from the colorshift data model to RGB (bit representation see packMode too)
YUV422
Binary
converted data from the colorshift data model to RGB (bit representation see packMode too)
YUV411
Binary
converted data from the colorshift data model to RGB (bit representation see packMode too)
YUV421
not yet supported image format
- colorModeOverwriteChannel
channel to select one of the color modes. The value of the channel has to be a string to let the widget seatch inside it enum list. This should be supported by the hardware IOC because this is hardware depended setting. If this is not available enable the combo boxes to do it manual
- packMode
packNo
no modification of the bit representation
MSB12Bit
for 12 bit color modes set most significant bit
LSB12Bit
for 12 bit color modes set least significant bit
Reversed
for YUV to reverse the decoding to VUY
- packingModeOverwriteChannel
channel to select one of the packing modes. The value of the channel has to be a string to let the widget seatch inside it enum list. This should be supported by the hardware IOC because this is hardware depended setting. If this is not available enable the combo boxes to do it manual
- showComboBoxes
enable/disable the visibility for changing the data interpretation from the user side
- ColorMap
- color map used to display experimental data to the 8Bit RGB world of a monitor
Maps
rough description
color_to_mono
grayscale images
mono_to_wavelength
different colors optimal for detector testing
mono_to_hot
red and yellow colloring
mono_to_heat
thermal representation
mono_to_jet
optimal for flow data
mono_to_custom
user defined color mapping
- customColorMap
QString: list of color values (value,r,g,b), seperated by a semicolon
- discreteCustomColorMap
QString: list of color values (value,r,g,b), seperated by a semicolon. This map is not smoothed over the value area.
- ROI_readChannelsList
edit list of 4 channels seperated by a semicolon to draw rectangle into the image
- ROI_readChannels
see the actual ROI_readChannelsList
- ROI_readmarkerType
- define the cursor marker for the selection
cursor
selection type
box
simple box
box_crosshairs
box with extra lines
line
line connection
arrow
arrow connection
- ROI_readType
- how the data from the channels are interpreted
type
description
none
data is ignored
xy_only
only the first 2 channels are used for a center
xy1_xy2
box with 2 coordinates
xyUpleft_xyLowright
box with a upper left and lower right version
xycenter_width_height
box with center coordinats and a size
- ROI_writeChannelsList
edit list of 4 channels seperated by a semicolon to write rectangle data into channels
- ROI_writeChannels
see the actual ROI_writeChannelsList
- ROI_writemarkerType
- define the cursor marker for the selection
cursor
selection type
box
simple box
box_crosshairs
box with extra lines
line
line connection
arrow
arrow connection
- ROI_writeType
- how the data is written to the channels
type
description
none
data is ignored
xy_only
only the first 2 channels are used for a center
xy1_xy2
box with 2 coordinates
xyUpleft_xyLowright
box with a upper left and lower right version
xycenter_width_height
box with center coordinats and a size
- channelXaverage
waveform channel to display a pixel wise plot into an image for the x-axis
- channelYaverage
waveform channel to display a pixel wise plot into an image for the y-axis
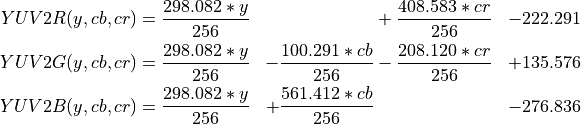
caCalc#
- Description:
The idea of caCalc is to have a posibility to do calculations for supporting and optimizing the graphical interface. Thinks like complex visibility and specific data handling/distributions. It is NOT meant for a simple replacement for a real IOC. The advantage of caCalc is to open a connection between channel data and data transportation and modification of Qt. This Signal/Slot mechanisem helps to access deeper graphical functionalities, like moving widgets aaround or get control over the main window e.g. remote displays.
- variable
this string generates a process wide variable (softPV) inside caQtDM. This contains the value of the calculation. If this string is empty there will be an automatic name generated, everytime the panels is opened. To guarantee that this name is unique caQtDM is using the UUID generator.
- variableType
- this defines the output type of the softPV. The only decission you can made is sclar or vector.
scalar
a single double
vector
an array of doubles
- foreground
defines the foreground color of the widget
- background
defines the background color of the widget
- channels
if variableType is vector you can add a number of single channels to a list. caCalc is generating a softPV that can be used for plotting
- channelList
visualisation of all channels
- calc
this string represents the calculation that is executed when one of the 4 channels got a monitor. The calculation is exactly the same mechanisem like in the calc or the calcout record in EPICS. There are additional way to use caCalc.
EPICS calc string
%/regexp/ : to use Regular Expressions
%QRect : to use Siganl/Slot mechanisem to control positions and size. For this you need to add all 4 channel properties a data source
%P/ : to use Python for calculations (extra support is needed during build time, typically only Linux support)
inside the calculation macros can be used.
- channel
data source for A can be a channel that gets the data over a plugin or a softPV. The reason for the not name this property not channelA is the naming in the origin of EPICS records.
- channelB
datas source for the value B
- channelC
datas source for the value C
- channelD
datas source for the value D
- initialValue
this property initialize the widget with this value enterd here
- precision
the precision gives the accuarcy of the graphical display part of this widget
- eventsignal
if you are using the Signal/Slot mechanissen you must change this property. Otherwise there will be no signals emitted. ================= ==================== Never there will never a signal generated onFirstChange there will be one signal emitted at the first change onAnyChange on every change ther will be signal emitted, this frequency can be sometimes a problem. TriggerZeroToOne there will be only signals when the value before was rounded 0 and now the rounded value is 1 TriggerOneToZero there will be only a signal when the value was rounded 1 and is now rounded 0 ================= ====================
- buddy
Qt specific property because of the object characteristic of the caCalc widget
caWaterfallPlot#
has no equivalent in MEDM.
Geometry is used for any object Description:
caBitNames#
has no equivalent in MEDM.
Geometry is used for any object Description:
caTable#
has no equivalent in MEDM.
Geometry is used for any object Description:
all graphical objects#
caLabel#
is the equivalent of Text in MEDM.
Geometry is used for any object Description:
caGraphics#
is the equivalent of all primary graphical objects (like circles, lines, arcs, triangles, arrows, …) in MEDM.
Geometry is used for any object Description:
caFrame#
has no equivalent in MEDM.
Geometry is used for any object Description:
caImage#
is the equivalent of image in MEDM.
Geometry is used for any object Description: Qt supports many graphics format, try yours to see if it will be displayed. The most interesting format however is the animated GIF format. These GIF image files may include multiple frames, transparency, and most other features supported by the GIF format. If the GIF image file has multiple frames, caQtDM can choose to animate the images or to display a specified frame. The default is to animate if there is more than one frame. To display a specific frame, enter an expression for the Image Calc that returns a frame number. Frame numbers start with 0. The syntax for the Image Calc expression is the same as that for the Visibility property, and it uses channels A-D in the Dynamic Attribute. The only difference is that the CALC expression should return a frame number, not True or False. The value will be rounded to the nearest integer. Frame numbers that are too high will use the last frame, and frame numbers that are too small will use the first frame. The Image will be black in EXECUTE mode if the Image Calc expression is invalid. The visibility of the Image is determined in the usual way if there is a channel specified. A multiple-frame Image updates with some speed even with no process variables specified for the Dynamic Attribute. Use the Image Calc expression and the process variables in the Dynamic Attribute to specify when to display each color.
There is an EPICS extension called Simple GIF Animator (SGA) for linux/Unix that allows you to create and modify animated GIFs for use in caQTDM.
There are also many other GIF animators available, especially for Microsoft Windows. It does not make any difference which platform you use to create or manipulate the images. You cannot use SGA or most of the animators to create the images themselves, only to add, delete, and rearrange them plus modify some of the GIF parameters. There are many drawing and image editing programs that allow you to create and edit images. For UNIX, the GNU Image Manipulation Program (GIMP)is a good choice and is free.
caPolyLine#
is the equivalent of Polyline and Polygone in MEDM.
Geometry is used for any object Description:
caInclude#
is the equivalent of the Composite in MEDM
Geometry is used for any object Description: caInclude objects are created by the designer as a new ui file to be included in a main file. For many operations they are treated as one object. Its uses also visibility (Color Mode, Visibility, Visibility Calc, Channels A-D) properties. One can specify macros. you can specify them by placing a semicolon after the file name and entering them like on the command line.
caDoubleTabWidget#
has no equivalent in MEDM and is not a controls object
Geometry is used for any object Description:
all controller objects#
caNumeric#
is the equivalent of the Wheelswitch in MEDM
Geometry is used for any object Description: The WheelSwitch has arrow buttons above and below the digits that are used to change individual digits, and it also accepts keyboard input. The up and down arrow buttons are the main feature of the WheelSwitch. You can click them to increment the digit. The arrow buttons can also be navigated and operated via the keyboard. You have to put the focus on the selected digit, which gets outlined by a red color. The cursor has to remain inside the widget otherwise the focus will be lost. The up and down arrow keys increment or decrement the selected digit. Clicking on an arrow button will increment or decrement the digit. The WheelSwitch will also accept input of a new value via the keyboard by double clicking on the value. Escape aborts the input. Type Enter to finish the input.
caApplyNumeric#
is the equivalent of the Wheelswitch in MEDM
Geometry is used for any object Description: The same behaviour as the Wheelswitch, with the difference that the value will be applied when pressing the apply button.
caSlider#
has no equivalent in MEDM
<Geometry is used for any object Description:
caShellCommand#
is the equivalent of the Shell command in MEDM
Geometry is used for any object Description:
caChoice#
is the equivalent of the Choice Button in MEDM
Geometry is used for any object Description:
column
The buttons are arranged in a row. (This appears to be a mistake, which will not be corrected because of existing screens.)
row
The buttons are arranged in a column. (This appears to be a mistake, which will not be corrected because of existing screens.)
row column
The buttons are automatically arranged in rows and columns.
caTextEntry#
is the equivalent of the Text Entry in MEDM
Geometry is used for any object Description:
caSpinBox#
represents a simplified Wheelswitch
Geometry is used for any object Description:
Requirements#
caQtDM requires that Qt, qwt and EPICS are installed. Actually the suported version are Qt4.6 and above, and qwt6.0 and above. Qt5 needs at least qwt6.1. The synoptic editor (designer) is part of Qt and the caQtDM objects are plugged into the designer. The help page for this can be called from the designer by pressing F1 on any object and requires the assistant which is a part of Qt. caQtDM runs in principle on any plattform and has been tested for several linux flavours and also on Microsoft Windows. For MAC OS some more work has to be done probably. Qt requires X11 forwarding on Linux and on Microsoft Windows it requires just the native window system.
Command Line Options#
caQtDM can be executed with the same options as MEDM; this is to be compatible with its options. the following options are supported:
option |
meaning |
|---|---|
|
describe the options |
|
has no effect (MEDM’s execute-only mode) |
|
attach to a running caQtDM process |
|
iconize the main window |
|
will replace the default stylesheet with the specified file (works only when not attaching) |
|
prevent resizing, works only when not attaching |
|
apply macro substitution to replace occurrences of |
|
will load macro definitions from file |
|
specifies the geometry (location and size) of the synoptic display |
|
|
|
print file and exit |
|
will save image file and exit |
|
will override the default epics3 datasource |
|
e.g. -option “updatetype=direct” will set the updatetype to Direct options for bsread: * bsmodulo,bsoffset, * bsinconsistency(drop|keep-as-is|adjust-individual|adjust-global), * bsmapping(provide-as-is|drop|fill-null) * bsstrategy(complete-all|complete-latest) |
|
will look for files on the specified url and download them to a local directory |
|
will empty the local cache used for downloading |
Parameters in square brackets [] are optional.
Examples#
Start up, performing macro substitution of all occurrences of $(a) and
$(c) in the display file, xyz.ui:
caQtDM -macro "a=b,c=d" xyz.ui &
Start up in execute mode; resize the display window corresponding to abc.ui to 100 by 100 pixels and move it to the location, x = 100 and y = 100; and move the display window corresponding to def.ui to x = 400 and y = 150:
caQtDM -dg 100x100+100+100 abc.ui &
Description Files#
With the Qt designer, you produce xml files with the extension .ui.
These files are used as input for the synoptic viewer caQtDM. These
xml ascii file can be edited by hand, but care has to be taken because
caQtDM and Qt designer do not tolerate any errors. Qt designer will
however tell you at what line the mistake is produced.
The files are normally loaded from the current directory and/or from
the directory specified by the environment variable
CAQTDM_DISPLAY_PATH. The directories are specified with the separator
: for linux and ; for microsoft windows.
Connection Problems and Access Rights#
Normally when caQtDM cannot connect the specified process variable, white colors will be drawn where the process variable is used. A list of unconnected process variables can be called through the menu of the main window of caQtDM. When a process variable is not writeable the cursor will change to some special sign.
Fonts#
The custom widgets make extensive use of the Qt font “Lucida Sans Typewriter”. In some cases where this font does not exist it will fall back to a font called “Monospace”. However the “Lucida” font is really the appropriated font to display numbers and it is warmly advised to have this font installed.
General Properties#
Geometry
All the widgets have geometry properties that can be set by the designer; these properties are normally at the top of the property sheet:
X Position |
x coordinate of the top left corner of the object relative to the display. |
Y Position |
y coordinate of the top left corner of the object relative to the display. |
Width |
Width of the object. |
Height |
Height of the object. |
Visibility
For the graphical objects except caDoubleTabWidget which is not a control widget
Color Mode |
Color Mode for the object. only for caGraphics, caLabel, and caPolyLine. See the Color Mode property |
Visibility |
Visibility mode for the object. See the Visibility Mode property. |
Visibility Calc |
A CALC expression that determines whether the object is displayed or not. The expression should return 0 for False and anything else for True. |
Channel A |
Name of the main process variable associated with the object. An A in the CALC expression is replaced by the value of this process variable, and the values corresponding to G through L are obtained from this process variable. |
Channel B |
Name of the second process variable associated with the object. A B in the CALC expression is replaced by the value of this process variable. |
Channel C |
Name of the third process variable associated with the object. A C in the CALC expression is replaced by the value of this process variable. |
Channel D |
Name of the fourth process variable associated with the object. A D in the CALC expression is replaced by the value of this process variable. |
See CALC Expressions for more details.
Color Mode
static |
Show the object in its normal colors. |
alarm |
Show the object in alarm colors based on the severity of the associated process variable. The alarm colors are Green for NO_ALARM, Yellow for MINOR_ALARM, Red for MAJOR_ALARM, White for INVALID_ALARM, and Gray if the alarm has an unknown value (because of an error in the record, for example). |
Visibility Mode
static |
The object is displayed always. Updating objects are always above non-updating objects. |
if not zero |
The object is displayed if the process variable is not zero. |
if zero |
The object is displayed if the process variable is zero. |
calc |
Use calc expression to determine the visability. |
Direction
For the Bar Monitor , Byte Monitor , Scale Monitor , and Slider
up |
Direction for the object is up or up/down. |
right |
Direction for the object is right or left/right. |
down |
Only used in the Bar Monitor. Otherwise, caQtDM treats this the same as up. |
left |
Only used in the Bar Monitor. Otherwise, caQtDM treats this the same as right. |
Label
For the Meter, Bar Monitor, Scale Monitor, and Slider.
none |
No extra features, except the limits are shown for the meter. You can eliminate the limits on the meter by resizing it vertically so they do not show. |
no decorations |
Same as none except for the Bar Monitor. For the Bar Monitor only the background and the bar show. This allows making bar graphs in caQtDM. |
outline |
Show limits. |
limits |
Show limits and a box for the value (except for the Slider, this does not have a box). |
channel |
Show limits and a box for the value and the process variable name (except for the Slider, this does not have a box). |
Text Align
horiz. left |
Align the text with the top left of the object. (Capital letters will line up with the top of the object, and the text will start at the left side of the object.) |
horiz. centered |
Align the text with the top center of the object. (Capital letters will line up with the top of the object, and the text will be horizontally centered in the object.) |
horiz. right |
Align the text with the top right of the object. (Capital letters will line up with the top of the object, and the text will end at the right side of the object.) |
vert. top |
No longer used. In |
vert. centered |
No longer used. In |
vert. bottom |
No longer used. In |
Text Format
For the Text Entry and Text Monitor . For all of the formats, the result depends on the number itself and the precision as returned from channel access for the process variable. The precision is typically the PREC field for the associated record. The PREC field is only determined when the process variable is connected, so subsequent changes to the PREC do not affect the format until the synoptic display is reloaded.
CALC Expressions
CALC expressions are used to determine visibility for graphical objects and to determine the frame number for the caImage, which also has a Dynamic Attribute. For visibility, the expression should return 0 for False, and anything else for True. For the frame number for the Image it should return a number, which will be rounded to the nearest integer. Frame numbers start with 0. The complete syntax of the CALC expression is described in detail in the Record Reference Manual found in the Epics Documentation under IOC software for any version of EPICS base, through at least Base 3.13. It is a case-independent C expression that can include functions such as ABS, SQR, MIN, MAX, CEIL, FLOOR, LOG, LOGE, EXP, SIN, SINH, ASIN, COS, COSH, ACOS, TAN, TANH, and ATAN, as well as the usual C operators, except that != is replaced by # and == is replaced by =. The letters A-L obtain their values from the Channels A-D and are replaced as follows.
A |
The value of Channel A. |
B |
The value of Channel B. |
C |
The value of Channel C. |
D |
The value of Channel D. |
E |
Reserved. |
F |
Reserved. |
G |
The COUNT of Channel A. |
H |
The HOPR of Channel A. |
I |
The STATUS of Channel A. |
J |
The SEVERITY of Channel A. |
K |
The PRECISION of Channel A. |
L |
The LOPR of Channel A. |
Examples are:
expression |
Show the object whenever the … |
|---|---|
|
… value of Channel A is zero |
|
… value of Channel A is not zero |
|
… value of Channel A is 12 |
|
… value of Channel A is not 12 |
|
… values of Channels A, B, and C are all negative |
|
… main process variable is within 90% of its HOPR or LOPR limits |
|
… SEVERITY of the main process variable is not 0 |
Macro Substitution#
Strings with the form $(name) in a .ui file can be replaced by some
other string, both on the command line and when calling a related
display. Specific directions for each of these
cases are given in the correspoonding sections of the manual. In
general, there is an argument string with the form
name1=value1[,name2=value2].... All occurrences of “(name1)” in the
.ui file are replaced with “value1”, then all occurences of $(name2)
are replaced by value2, etc. The substitition is recursive; that is,
if value1 contains an occurrence of $(name2), then when name2=value2
is processed, that occurrence will be replaced by value2.
Drag-And-Drop#
You may drag and drop an item (such as a pv name aquired through get-info) to some destination, however there is no drag and drop possibility between Qt and X11. When using KDE you may drag and drop to a console. To simply copy and paste you can call the pv info box and get the variable you want to paste.
Main Window#
The main window of caQTDM presents messages, a menu bar and a status bar. The menu bar has the following items:
Menu |
Open File |
calls a dialog box for opening a |
Reload |
will close and reload all displays; very handy during editing |
|
Exit |
will exit caQTDM |
|
About |
gives some information about the build and author |
|
PV |
will display a list of unconnected PV’s |
|
UpdateType |
Direct |
When caQtDM is in this mode, all the monitors will be displayed as soon as they come |
Timed |
When caQtDM is in this mode, all the monitors will be displayed with a maximum rate of 5Hz, however this rate can be set individually by a JSON string after the channel (edited in the designer) with the following syntax, x being the pv name: x.{“caqtdm_monitor”:{“maxdisplayrate”:20}} Here you can choose your display rate. |
The Status bar will display the following information: memory used by caQtDM, the number of connected and unconnected PV’s, the number of monitors per second, the number of displays per second and the monitor with the highest rate.
Help#
You may obtain help for any widget in the designer by pressing F1. For the caQtDM custom widgets the help file generated from this html file should be registered by the Qt assistant.
Resizing Displays#
In caQtDM you can resize the synoptic display windows without using Qt layouts. You can build a display normally and everything will be resized when you resize the window. Furthermore, you could try Qt designer layouts (for experts only)
Printing#
By pressing the right mouse button on the background of your synoptic display you can get a context menu with the item “Print”. Normally you should get a print dialog.
Environment Plugin#
There is an environment plugin which allows to get environment variables just like PVs. To use this plugin, the value of “channel” in the designer has to be set to “environment://yourEnvironmentVar” Then caQtDM will get the environment variable after “environment://”, in this case “yourEnvironmentVar” and return it just like any other PV.
Unit Replacements#
When displaying values with units, it can happen that some characters cannot be drawn correctly, thus generating faulty units. This can be due to special display settings or configuration on the client, like a special linux build or manual font settings, leading to characters being drawn incorrectly. There could also be limitations to which characters can be handled by EPICS. To address this issue, unit replacements can be done by the user. This means, all unit strings will be scanned for the given source characters ( or -sequences) and every occurrence will be replaced by the given replacement characters ( or -sequence). Unit replacements do not affect the UI file or EPICS data and are purely visible and around for the caQtDM process that was started with them. To start a caQtDM process with custom unit replacements, the following environment variable has to be set with the wanted replacements: CAQTDM_CUSTOM_UNIT_REPLACEMENTS The syntax for the custom unit replacements is as follows: The characters are written either in utf-8 coded characters or as a hexadecimal or decimal code for the character in utf-8 coding. Hexadeciaml codes need to start with “0x”, caQtDM will try to parse all other characters first as a decimal code, if they are not purely numerical it will interpret them as utf-8 coded characters. Multiple characters that should be treated as one string have to be seperated by comma (,). If you use utf-8 coded characters, you can also just write them as a string without the need for commas. so “hi” would be written as “0x48,0x69”, or simply just “hi”. Double quotes are possible but removed by caQtDM when parsing the environment variable, single quotes are treated literally as characters to replace, so don’t use them to encapsulate. You have to first write the source characters you want to replace, then an equal sign (=) and finally the replacement characters that should be drawn instead. To set multiple character replacements, seperate them by semicolon (;). Parts that dont contain an equal sign but are seperated from other parts with semicolon are ignored. All put together this would be the structure: CAQTDM_CUSTOM_UNIT_REPLACEMENTS={sourceCharacters}={replacementCharacters};{anotherReplacement} An example (that doesnt make much sense but displays many possibilities) would be: CAQTDM_CUSTOM_UNIT_REPLACEMENTS=charsToReplace=charsToUse;0x48,0x68=bye;charsWithHex,0x4f=something;?=o It can be seen that all combinations of strings, hex- and deciaml character codes are possible to form a source or replacement string. All replacements will be done sequentially, with the leftmost replacements being done first. Therefore, it can also be possible, that later replacements replace characters in a string that has already been replaced before by another replacements. When doing custom unit replacements, always consider that your replacements might not be done to the original string from EPICS, but on the already processed string with the default unit replacements. To see how they are implemented, you might want to check out teh first few lines in caQtDM_Lib/src/mutexKnobData.cpp There are already some default unit replacements that were introduced because common systems had difficulties displaying widely-used characters. Those unit replacements always take place before custom unit replacements, you can disable them by setting the following environment variable to “false”: CAQTDM_DEFAULT_UNIT_REPLACEMENTS It is not recommended to disable them, as they are tested on all common systems and should be working with most clients, however disabling might help in some edge cases.
Environment Variables#
caQtDM uses the following environment variables:
form QT and EPICS Library:
|
to find the plugins of qt and others |
|
see EPICS Documentation |
|
see EPICS Documentation |
from caQtDM:
|
A colon-separated (semi-colon-separated on Mircosoft Windows) list of directories in which to look for display files. Only looks in the current working directory if not specified. Related Displays have to be in your current directory or in this path |
|
paths to look for ui and stylesheet files to download via http |
|
A list of commands for the Context Menu . See the Context Menu Customization for the format. |
|
for backwards compatability |
|
Enviroment file for Mobile devices |
|
to exit caQtDM after some amount of time |
|
override all other find record settings (direct json http download) |
|
for autocompletion, the request URL |
|
search limitation for a facility |
|
search limit max number of entries |
|
if set to “false”, default unit replacements are disabled. |
|
define custom unit replacements. They are replaced after default replacements took place, if enabled.You can use unicode characters or hexadecimal / decimal utf-8 character codes, seperated by (,) , (=) and (;). |
|
If caQtDM was started with -print this will specify the name of the screenshot file |
|
Disables widgets from being updated while a file is being opened. This can reduce load times of big panels by more than 50%. Values: “TRUE”, “FALSE” , without quotes |
|
If set to “TRUE”, caQtDM will create a logfile containing all of the input from the message window. If caQtDM exits successfully, this file gets deleted after termination. |
|
This specifies the path where the logfile, if logging is active, will be stored. |
from plugins:
|
point the bsread plugin to the dispatcher |
|
control the connection type of the bsread plugin Can be set to “pub_sub”, else default “push_pull” is used |
|
point the bsread plugin to static sources |
|
point the archiveSF plugin to a different archiver backend |
|
point the archiveHTTP plugin to a different backend |
|
Specify the “backend” parameter for archiver api queries, which is used if none is set in the widget. |
|
Overrides any other definition of the “backend” paramter for queries, including dynamic properties in the widget. |
|
Overwrite the default api path for binned data. Needs to be in the format: /path/to/binned |
|
Overwrite the default api path for raw data (events). Needs to be in the format: /path/to/events |
|
Overwrite the default path to fetch the list of available backends. Needs to be in the format: /path/to/backend/list |
|
Disable Epics3 connections when tabwidget is not active Set to “TRUE” to activate |
|
Database to use for the modbus plugin |